

Antentop is FREE e-magazine devoted to Antennas and Amateur Radio an
Special page devoted to
Bridge Effect

Custom Search
|
ANTENTOP- 01- 2014 # 018 |
Bridge Effect |
|
|
|
|
|
|
Picture of the increasing
is the same as for picture of the decreasing of MW reception.
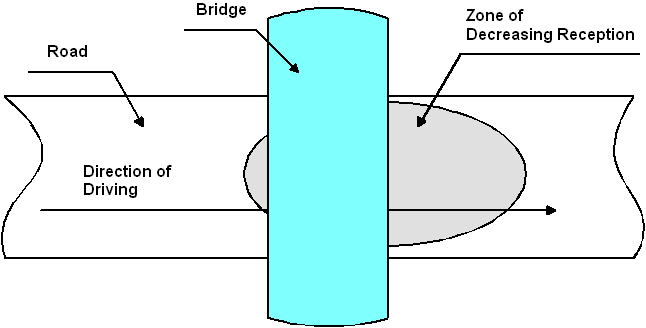
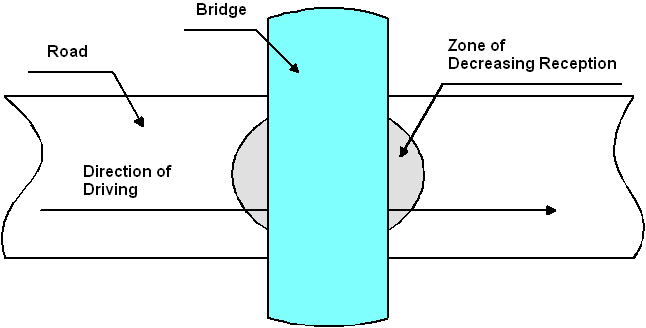
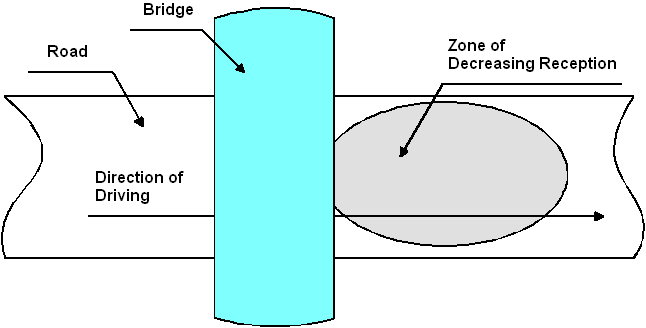
So it is the same as shown on Figures 4, 5, 6. Only the volume is increased instead decreasing as shown
at the Figures. What it depends on?
|
Figure 4 Typical zone of attenuation under the bridge |
|
|
At the same time of
year, at the practically the same weather and traffic, today bridge
did decreasing in volume of the MW radio, next day the bridge
did increasing in the volume, and the next day did no influence
to the reception. I noticed that the
same effect is usually observed for 3- 5 bridges in one direction.
So, if one bridge did decreasing in reception so as the rule the
next 3- 5 bridges also did decreasing in reception of MW radio.
If one bridge did increasing
in reception so as the rule the next 3- 5 bridges also did increasing
in reception of MW radio. |
Figure 5 Zone of attenuation strictly under the
bridge |
|
|
There are some bridges
that have stable effect. The bridges always did decreasing in
reception of MW radio or did not influence to the reception. However I newer did not find bridges that stable increased the radio
reception in MW Band.
73! va3znw
|
Figure 6 Zone of attenuation
at the exit out of the bridge |
|
|
|
||
|
Page- 96 |
||
 |
 |
|
 |
Just for Fun:

Powered byIP2Location.com
Thanks for your time!
Last Updated:
January 7, 2020 22:50


