
 NEC-2 and NEC-4: Reading Trends with Caution
A case in point came to light while doing some work with NEC-2 on some simple 1/4 wl vertical monopoles with ground planes of various sizes--both as free space models and as highly elevated antennas. The test frequency was 7.05 MHz, and all antenna elements were specified as aluminum (6061- T6). The 1/4 wl vertical section remained constant: 10.1346 m long with a diameter of 50 mm. The test radials systems included 4, 8, 16, and 32 radials, all of 6.35 mm diameter. 32 radials is at the limit of wires to a single junction recommended for NEC-2.
As an interesting side note, the length of the radials, when uniformly adjusted to achieve resonance without changing the length of the vertical element, underwent changes as the table below shows.
Number of Radials        Length of Radials in meters
      4                       11.796
      8                       12.314
     16                       12.588
     32                       12.863
Both NEC-2 and NEC-4 showed resonance (within the limits of +/- j 1 Ohm) with these lengths both in free space models and with models whose base was 40 m high (with a vertical top height of 50.1346 m). In this regard, the two programs are well-calibrated to each other.
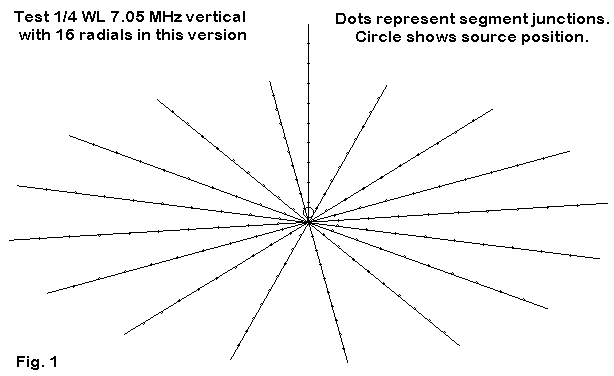
Figure 1 shows one version of the model used, this one with 16 radials. Since the object of the exercise was not extreme precision relative to an actual antenna, simplified modeling procedures were used. Each element has 10 segments (resulting in a 330-segment model with 32 radials). The source is placed on the lowest segment of the vertical element. (Somewhat greater accuracy might be obtained by length tapering all wires toward the junction, although it is advisable to create a separate wire for the source and length taper the vertical wire above it so that the source segment and all adjacent segments are as close to the same length as feasible.)
For the examination of trends, the simple model sufficed. It had been run in two implementations of NEC-4 (EZNEC Pro from W7EL and GNEC from Nittany Scientific) with no differences of either gain or source impedance that amounted to anything more than rounding conventions unique to each implementation. The maximum difference in reported source resistance was 0.02 Ohms, and the maximum reported difference in source reactance was 0.03 Ohms (with this last difference occurring only once). Gain figures coincided exactly to 2 decimal places, and TO values were exact to 2 significant figures, the limits checked.
NEC-2 is another matter. The NEC-2 core has been around for many years and has been updated and customized by those offering full implementations. The are 16-bit and 32-bit versions as well. The same models were run on the version of NEC-2 included with EZNEC Pro and with the 32-bit version provided with NECWin Pro. As one might expect, output data from NEC-2 does not replicate that from NEC-4. However, for a given model and situation, all source values among the 2 versions of NEC-2 and the NEC-4 versions were within 0.3 Ohms resistance and 0.5 Ohms reactance. Gain values were within 0.07 dB.
These differences are all operationally insignificant. However, the object of the test was to study the trends in values, especially gain, for the increasing number of radials in the models, both in free space and 1 wl over various types of ground. The types of ground used were those classified as "very good" (cond.=0.0303 S/m; D.C=20), average (cond.=0.005 S/m; D.C=13), and very poor (cond.=0.001 S/m; D.C=5).
The charts below compare the gain output for both versions of NEC-2 (NWP=NECWin Pro; EZ-2=EZNEC Pro) with the gain output for NEC-4 (the same in both implementations).
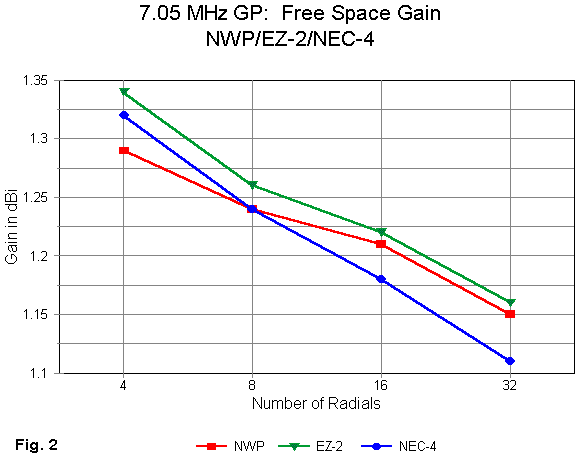
Note that, in Figure 2, the NEC-4 decrease in gain is nearly linear for a geometric increase in the number of radials. The curves for NEC-2 for each program show the same trends and are nearly parallel to the NEC-4 curve. These are the curves which might set up some anticipations of values in other contexts for all NEC programs.
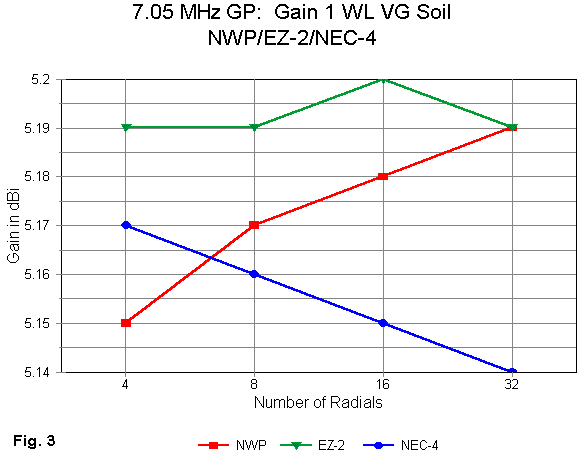
The NEC-4 curve in Figure 3 shows the same type of decreasing gain pattern as it did in free space. However, the EZNEC-2 values are flat--or nearly so, since the hump in the curve represent a gain change of 0.01 dB, which might be an artifact of rounding. The NWP curve, however, shows a distinct and almost linear increase in value, although the values themselves are closer to those yielded by NEC-4. (Elevation angle of maximum radiation is 24 degrees. for all curves.)
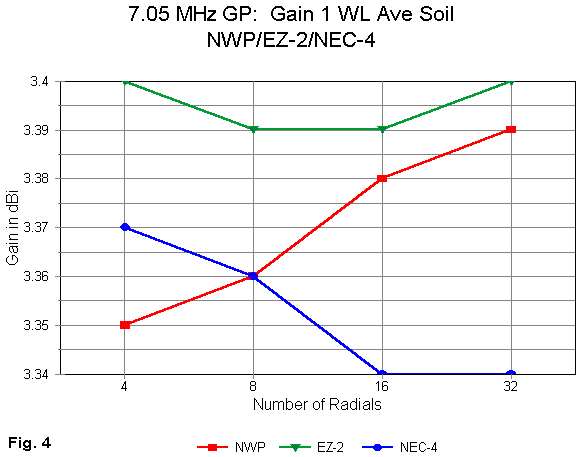
Although the NEC-4 curve in Figure 4 is not visually linear, the degree off linear is only 0.01 dB, again, possibly due to rounding. The NWP curve is again closer in value to the NEC-4 curve, but it ascends. The EZNEC-2 figures are flat within a 0.01 dB range. The elevation angle of maximum radiation moved from 26 degrees to 25 degrees as the number of radials increased.
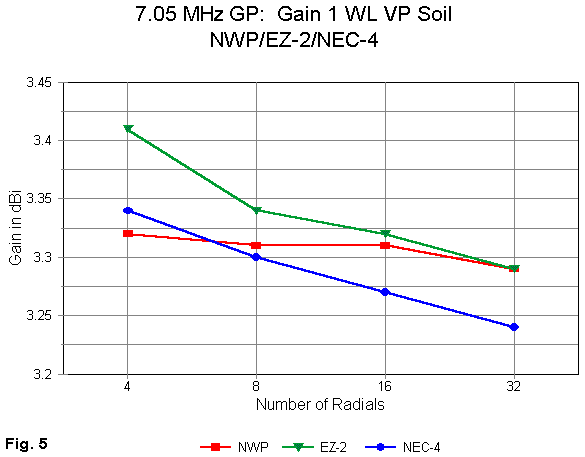
The curves in Figure 5 all show descending tendencies, with the NEC-4 curve being the most linear. The elevation angle of maximum radiation was 11 degrees for all cases. (Those who insist that good soil is a necessity in the territory of a highly elevated vertical monopoles should study the effects of soil more thoroughly. Although the gain values for average soil and for very poor soil are quite close, with the 1 wl base height of the antenna, the very poor soil allows the gain to appear in the lowest lobe, while with average soil, the highest gain appears in the next lobe upward.)
If one asks the question, "What are the trends in values as we add more radials to a free space or highly elevated ground plane antenna system model?" no single answer emerges that is wholly reliable. The NEC-2 curves show sufficient variation from one implementation to another and from one soil type to another, that it would be untenable to insist upon any trend from the data. What one implementation gives, the other takes away, whether in terms of curve shape or coincidence of values with NEC-4.
Even the NEC-4 curves must be treated with caution. The curves are internally consistent from one case to the next, which increases the confidence that they exhibit a general trend. However, nothing in the models identifies the trend as being either an accurate reflection of reality or simply a calculational trend of the computational core.
Since this exercise was performed without access to the codings of either the core or the specific implementations of the input and output systems used, one is left without means of settling the disjunction. This situation is the one most common to users of NEC-2 and NEC-4. Hence, reading trends from small variations in program outputs must be done with extreme caution, whether those variations are regular or irregular.
It is easy to read too much into visually apparent numerical differences
below the level of operational significance. Hopefully this exercise may
provide a sufficient cautionary note in the opposite direction. If the
question of whether or not a trend is simply an artifact of the
computational system cannot be settled, the claim of a trend may be dubious
at best. Moreover, it pays to cross check one implementation of a
computational system with another before before deciding that one has a
trend in the first place.
1/4 wl w/GP: 7.05 MHz                        09-12-1998     06:34:16
Frequency = 7.05  MHz.
Wire Loss: Aluminum -- Resistivity = 4E-08 ohm-m, Rel. Perm. = 1

              --------------- WIRES ---------------
Wire Conn. --- End 1 (x,y,z : m )  Conn. --- End 2 (x,y,z : m )   Dia(mm) Segs
1            0.000,  0.000, 10.135  W2E1   0.000,  0.000,  0.000 5.00E+01  10
2     W3E1   0.000,  0.000,  0.000        11.796,  0.000,  0.000 6.35E+00  10
3     W4E1   0.000,  0.000,  0.000         0.000, 11.796,  0.000 6.35E+00  10
4     W5E1   0.000,  0.000,  0.000       -11.796,  0.000,  0.000 6.35E+00  10
5     W1E2   0.000,  0.000,  0.000         0.000,-11.796,  0.000 6.35E+00  10

              -------------- SOURCES --------------
Source    Wire      Wire #/Pct From End 1    Ampl.(V, A)  Phase(Deg.)  Type
          Seg.     Actual      (Specified)
1          10     1 / 95.00   (  1 /100.00)      1.000       0.000       V

Ground type is Free Space
1/4 wl w/GP: 7.05 MHz                        09-12-1998     06:35:05
Frequency = 7.05  MHz.
Wire Loss: Aluminum -- Resistivity = 4E-08 ohm-m, Rel. Perm. = 1

              --------------- WIRES ---------------
Wire Conn. --- End 1 (x,y,z : m )  Conn. --- End 2 (x,y,z : m )   Dia(mm) Segs
1            0.000,  0.000, 50.135  W2E1   0.000,  0.000, 40.000 5.00E+01  10
2     W3E1   0.000,  0.000, 40.000        12.588,  0.000, 40.000 6.35E+00  10
3     W4E1   0.000,  0.000, 40.000        11.630,  4.817, 40.000 6.35E+00  10
4     W5E1   0.000,  0.000, 40.000         8.901,  8.901, 40.000 6.35E+00  10
5     W6E1   0.000,  0.000, 40.000         4.817, 11.630, 40.000 6.35E+00  10
6     W7E1   0.000,  0.000, 40.000         0.000, 12.588, 40.000 6.35E+00  10
7     W8E1   0.000,  0.000, 40.000        -4.817, 11.630, 40.000 6.35E+00  10
8     W9E1   0.000,  0.000, 40.000        -8.901,  8.901, 40.000 6.35E+00  10
9    W10E1   0.000,  0.000, 40.000       -11.630,  4.817, 40.000 6.35E+00  10
10   W11E1   0.000,  0.000, 40.000       -12.588,  0.000, 40.000 6.35E+00  10
11   W12E1   0.000,  0.000, 40.000       -11.630, -4.817, 40.000 6.35E+00  10
12   W13E1   0.000,  0.000, 40.000        -8.901, -8.901, 40.000 6.35E+00  10
13   W14E1   0.000,  0.000, 40.000        -4.817,-11.630, 40.000 6.35E+00  10
14   W15E1   0.000,  0.000, 40.000         0.000,-12.588, 40.000 6.35E+00  10
15   W16E1   0.000,  0.000, 40.000         4.817,-11.630, 40.000 6.35E+00  10
16   W17E1   0.000,  0.000, 40.000         8.901, -8.901, 40.000 6.35E+00  10
17    W1E2   0.000,  0.000, 40.000        11.630, -4.817, 40.000 6.35E+00  10

              -------------- SOURCES --------------
Source    Wire      Wire #/Pct From End 1    Ampl.(V, A)  Phase(Deg.)  Type
          Seg.     Actual      (Specified)
1          10     1 / 95.00   (  1 /100.00)      1.000       0.000       V

Ground type is Real, high-accuracy analysis
Conductivity = .005 S/m    Diel. Const. = 13
              --------------- MEDIA ---------------
Medium          Conductivity(S/m)   Dielectric Const.    Ht(m )   R Coord(m )
1                   5.000E-03            13.00           0 (def)     0 (def)
Updated 9-12-98. © L. B. Cebik, W4RNL. Data may be used for
personal purposes, but may not be reproduced for publication in print or
any other medium without permission of the author.