Every commercial implementation of either NEC or MININEC tries to anticipate the needs of its users. Therefore, each tries to provide crucial data in the most usable form. Polar plots, SWR sweeps, etc. appear in graphical form, with supplementary numerical data. Some data is available in tabular form, often modified to make it more readable. Thus, a typical NEC output value of 2.1356E-03 will be rounded to 0.0021.
Behind every form of data made available to the user lies a basic NEC core output table--or, more correctly, a collection of tables. Once you have generally mastered the readily available information, it is time to look at the core output in order to gather new data, refine data already in hand, and even to get a new slant on existing data.
So let's look at a typical NEC core output file for a simple antenna: the 10-meter center-loaded dipole shown in Fig. 1.
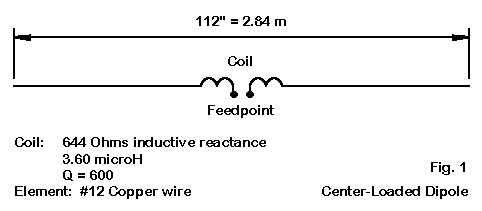
The antenna consist of a single modeled wire with 41 segments (each about 2.75" long for the overall 112" antenna length). The antenna wire is copper, with its characteristic loss factor. The center-loading coil is specified as a resistance and reactance (1 Ohm and 644 Ohms), which is equivalent to a 3.6 microH coil with a Q of about 600. Since we are using only one frequency for this model, the impedance load and the R-L-C load are equivalent. We shall set the antenna in free space, with no transmission lines, networks, or other complexities. This much of a model will already introduce us to an episode's worth of information from the NEC core output.
Let's take up the core output a bit at a time. In many cases, the old "green sheet" output width of the data will be too wide for our screen, so I shall omit some columns of less interest to us here. (In other contexts, they may hold great interest.) Note that NEC operates only in meters, and converts everything to that measure. For simplicity, I have preconverted the data from our 112" antenna. Also note that NEC uses a radius, although conventional input systems let you input wire diameters or AWG wire sizes.
                  - - - STRUCTURE SPECIFICATION - - -

                     COORDINATES MUST BE INPUT IN
                     METERS OR BE SCALED TO METERS
                    BEFORE STRUCTURE INPUT IS ENDED

  WIRE
  NO.      X1       Y1      Z1        X2       Y2       Z2     RADIUS  SEG.
     1  0.00000  0.00000  0.00000   2.84480  0.00000  0.00000  0.00103   41
      STRUCTURE SCALED BY FACTOR   1.00000
TOTAL SEGMENTS USED= 41  NO. SEG. IN A SYMMETRIC CELL= 41  SYMMETRY FLAG= 0
         - MULTIPLE WIRE JUNCTIONS -
 JUNCTION    SEGMENTS  (- FOR END 1, + FOR END 2)
  NONE
This portion of the file essentially replicates your wire entry for the antenna element(s). It is a good cross check against what you thought you entered. However, NEC goes further and sorts out every wire segment and its connections. Only the first 5 segments are shown below--with some columns omitted.
                  - - - - SEGMENTATION DATA - - - -

                        COORDINATES IN METERS
         I+ AND I- INDICATE THE SEGMENTS BEFORE AND AFTER I

  SEG.   COORDINATES OF SEG. CENTER     SEG.   WIRE    CONNECTION DATA  TAG
  NO.       X         Y         Z     LENGTH   RADIUS     I-   I    I+  NO.
   1   0.03469   0.00000   0.00000   0.06939   0.00103    0    1    2    1
   2   0.10408   0.00000   0.00000   0.06939   0.00103    1    2    3    1
   3   0.17346   0.00000   0.00000   0.06939   0.00103    2    3    4    1
   4   0.24285   0.00000   0.00000   0.06939   0.00103    3    4    5    1
   5   0.31223   0.00000   0.00000   0.06939   0.00103    4    5    6    1
Note that each segment is located by the coordinates of its center, which is the focal point of NEC calculations. (MININEC focuses upon pulses, which are located at segment junctions or ends.) The connection data can be important in checking to ensure that complex wire structures that you devise are connected where you want them and not connected where you wish the wires to be separated.
Many implementations of NEC have error checking routines. However, they cannot read the modeler's intentions. If you transpose numbers in a coordinate (for example, 42 instead of 24), the error checker will not catch the error unless it results in a standard error, such as wires that connect within a segment. Reviewing the coordinates of the segments and their connections is a good supplemental error check routine.
INPUT LINE   1  EX   0    1   21    0  1.00000E+00  0.00000E+00
                      0.00000E+00  0.00000E+00  0.00000E+00  0.00000E+00
INPUT LINE   2  LD   4    1   21   21  1.00000E+00  6.44000E+02
                      0.00000E+00  0.00000E+00  0.00000E+00  0.00000E+00
INPUT LINE   3  LD   5    1    1   41  5.80010E+07  0.00000E+00
                      0.00000E+00  0.00000E+00  0.00000E+00  0.00000E+00
INPUT LINE   4  FR   0    1    0    0  2.85000E+01  0.00000E+00
                      0.00000E+00  0.00000E+00  0.00000E+00  0.00000E+00
INPUT LINE   5  RP   0    1  361 1000  9.00000E+01  0.00000E+00
                      1.00000E+00  1.00000E+00  0.00000E+00  0.00000E+00
Each of the "Input Line" Entries is actually a single report line (split here to ensure that it fits the screen). These lines register the control cards. In this model, we have the source information (wire and segment of placement and the magnitude and phase of the source voltage); the center loading coil load (Type 4 impedance load showing wire and segment of placement and the resistance and reactance); the wire conductivity (showing the wire of placement and the segment range, as well as the conductivity of copper); the frequency request (a single frequency: 28.5 MHz); and the pattern request (an azimuth pattern of 360 degrees at zero degrees elevation, which NEC expresses as a 90-degree theta angle).
These entries are once more useful as cross checks on what you intended to put into your model. To read values, you must grow accustomed to engineering notation (for example, 5.80010E+07) and to the positions of information along each line.
                 - - - - - - FREQUENCY - - - - - -
                     FREQUENCY= 2.8500E+01 MHZ
                   WAVELENGTH= 1.0519E+01 METERS
NEC reads the frequency in MHz and provides its equivalent in wave length. If you multiply the two figures, you will find that NEC uses 2.997915E+06 m/s as the speed of electromagnetic radiation.
Since our antenna is in free space, we can skip over the "Antenna Environment" entry to the loading lines.
             - - - STRUCTURE IMPEDANCE LOADING - - -

LOCATION                  IMPEDANCE (OHMS)      CONDUCTIVITY           TYPE
ITAG FROM THRU            REAL      IMAGINARY   MHOS/METER

 1   21   21           1.0000E+00   6.4400E+02              FIXED IMPEDANCE
 1    1   41                                    5.8001E+07             WIRE
NOTE: SOME OF THE ABOVE SEGMENTS HAVE BEEN LOADED TWICE - IMPEDANCES ADDED
These lines have unused columns omitted (those used for R-L-C loads). NEC uses the mathematical terminology of "real" and "imaginary" in place of the electrical terms "resistive" and "reactive" to characterize not only impedance, but as well every other quantity which may also have a phase angle. Note also that segment 21 (the element center segment) has both the impedance load and the wire conductivity load. Since conductivity is a measure per unit length, one cannot simply arithmetically add resistances to obtain the value used by NEC on that segment. The "Tag" and ITag" notations refer to the wire number.
              - - - ANTENNA INPUT PARAMETERS - - -

TAG   SEG.      VOLTAGE (VOLTS)           CURRENT (AMPS)
NO.   NO.      REAL        IMAG.         REAL        IMAG.
 1    21   1.00000E+00 0.00000E+00   5.80233E-02 1.91669E-03
                IMPEDANCE (OHMS)          ADMITTANCE (MHOS)        POWER
                REAL        IMAG.         REAL        IMAG.       (WATTS)
           1.72157E+01-5.68686E-01   5.80233E-02 1.91669E-03   2.90117E-02
The "Antenna Input Parameters" report is actually a single line entry. Because of its length, I have split it to ensure a screen fit.
NEC calculates the mutual impedances of all segments in a total antenna structure. With these figures, plus the source values (1 volt at 0-degrees phase angle in our example), the source or feedpoint collection of values can be calculated from Ohms Law and its derivative power equation. Admittance, of course, is simply the reciprocal of impedance. Had we set the voltage at a value other than 1.0, the other values (except the impedance and the admittance) would have changed accordingly.
Some implementations permit the use of current sources by a network from a distant true voltage source to the user-designated source segment. Other implementations scale these figures so as to allow the user to specify a constant power value.
Among the most important information provided by the NEC core output file is the current data. What follows is the table for 1/2 of the antenna we are using as our example. The other half of this symmetrical single element would show the same values in reverse order.
                - - - CURRENTS AND LOCATION - - -
            LENGTHS NORMALIZED BY WAVELENGTH (OR 2.*PI/CABS(K))

SEG. TAG   SEG. CENTER     SEG.          - - - CURRENT (AMPS) - - -
NO. NO.   X      Y    Z  LENGTH    REAL       IMAG.        MAG.       PHASE
 1  1   0.0033  0.0  0.0 0.00660  2.1353E-03 3.4527E-05   2.1356E-03  0.926
 2  1   0.0099  0.0  0.0 0.00660  5.6942E-03 9.6119E-05   5.6950E-03  0.967
 3  1   0.0165  0.0  0.0 0.00660  8.9690E-03 1.5790E-04   8.9704E-03  1.009
 4  1   0.0231  0.0  0.0 0.00660  1.2127E-02 2.2233E-04   1.2129E-02  1.050
 5  1   0.0297  0.0  0.0 0.00660  1.5203E-02 2.8992E-04   1.5205E-02  1.093
 6  1   0.0363  0.0  0.0 0.00660  1.8213E-02 3.6086E-04   1.8216E-02  1.135
 7  1   0.0429  0.0  0.0 0.00660  2.1165E-02 4.3528E-04   2.1169E-02  1.178
 8  1   0.0495  0.0  0.0 0.00660  2.4062E-02 5.1323E-04   2.4068E-02  1.222
 9  1   0.0561  0.0  0.0 0.00660  2.6908E-02 5.9476E-04   2.6915E-02  1.266
10  1   0.0627  0.0  0.0 0.00660  2.9703E-02 6.7991E-04   2.9711E-02  1.311
11  1   0.0693  0.0  0.0 0.00660  3.2448E-02 7.6871E-04   3.2457E-02  1.357
12  1   0.0759  0.0  0.0 0.00660  3.5144E-02 8.6124E-04   3.5154E-02  1.404
13  1   0.0825  0.0  0.0 0.00660  3.7791E-02 9.5760E-04   3.7803E-02  1.452
14  1   0.0890  0.0  0.0 0.00660  4.0392E-02 1.0579E-03   4.0406E-02  1.500
15  1   0.0956  0.0  0.0 0.00660  4.2951E-02 1.1625E-03   4.2966E-02  1.550
16  1   0.1022  0.0  0.0 0.00660  4.5472E-02 1.2717E-03   4.5490E-02  1.602
17  1   0.1088  0.0  0.0 0.00660  4.7967E-02 1.3861E-03   4.7987E-02  1.655
18  1   0.1154  0.0  0.0 0.00660  5.0456E-02 1.5070E-03   5.0478E-02  1.711
19  1   0.1220  0.0  0.0 0.00660  5.2978E-02 1.6367E-03   5.3003E-02  1.769
20  1   0.1286  0.0  0.0 0.00660  5.5668E-02 1.7830E-03   5.5697E-02  1.834
21  1   0.1352  0.0  0.0 0.00660  5.8023E-02 1.9167E-03   5.8055E-02  1.892
I have truncated the 0.00000 entries for the Y and Z coordinates to make the table fit the space available. Note that the coordinate positions for the current placements are the segment centers. For this single element antenna, you can simply compare the current placement coordinates with the coordinates given in the segmentation data section of the report.
Current values are based on the source voltage and the impedance, accounting for losses within a given segment. NEC reports these currents in two ways: as real and imaginary components and as a current magnitude and phase angle. For our center-loaded dipole, the curve of the current magnitude and phase are shown in Fig. 2.
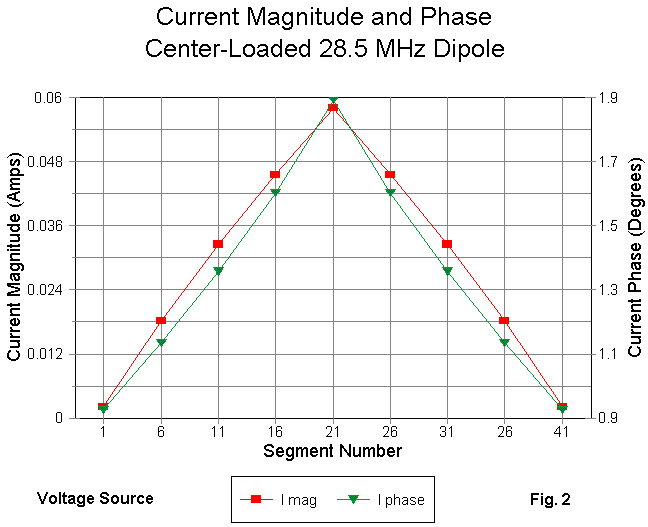
The current magnitude is shown on the left Y-axis, while the current phase value is shown on the right Y-axis. Note that neither curve is linear. Many users find that the current values are more meaningful when normalized to a source current of 1.0 with a phase angle of zero degrees.
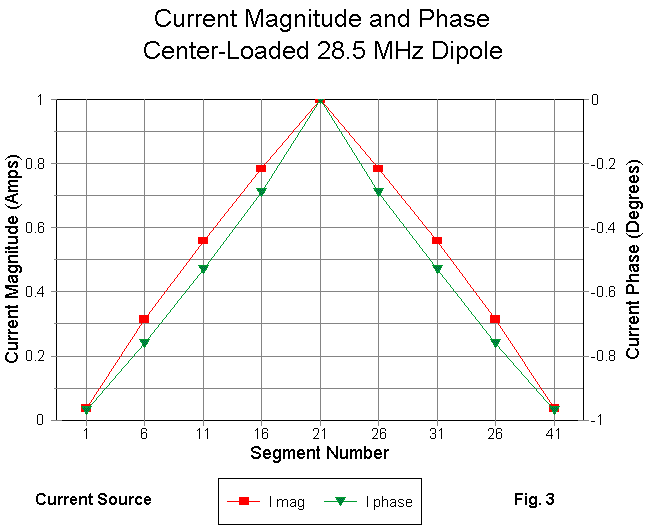
Fig. 3 replots the data using a current source as just specified. Now it is clear how the current levels at various points along the antenna wire compare with the source current. As well, with the phase angle referenced to zero, the amount of phase shift along the element is also clearer. (The nearly 1-degree phase shift is far more interesting than it is significant to antenna performance.)
Different implementations of NEC provide differing ways of plotting the current data. Curves may be overlaid on outline drawings of the antenna elements--or they may be shown in color transitions rather than as curves. Some programs contain rectangular plot capabilities for plotting current. Virtually all programs make the current location and level data available as an immediate program output, thus saving the user the time of searching it out in the large NEC output file.
Detailed current data can be instructive about antenna performance. Our single loaded element is far too simple to hold any surprises. However, I was surprised when examining a model of a tri-band beam to discover, first, that a 20-meter director had a very significant current magnitude on it (compared to the other directors) when the operating frequency was within the 10-meter band. The second surprise came from examining the current magnitude along the element. Although about 1 wl long at the 10-meter operating frequency, the 20-meter element showed a single current maximum at its center with ever-decreasing levels outward from the center. The 20-meter element was very actively involved in the formation of the pattern from the Yagi on 10 meters. In fact, its length--set for 20-meter performance--provided a limit on the operating bandwidth on 10 meters, pushing the performance curves closer to one end of the band than the other. For this particular model, changing the length of the 20- meter director could enhance performance across the first MHz of 10 meters, but at the expense of performance on 20 meters.
                   - - - POWER BUDGET - - -

                INPUT POWER   = 2.9012E-02 WATTS
                RADIATED POWER= 2.6950E-02 WATTS
                WIRE LOSS     = 2.0613E-03 WATTS
                EFFICIENCY    =  92.90 PERCENT
The "Power Budget" report in the NEC output file can be very instructive when considering an antenna by itself and when comparing more than one competing design. For our center-loaded dipole, the efficiency (the ratio of radiated power to input power X 100) is considerably less than that of an unloaded full-length dipole. The wire loss is the sum of all resistive losses in the antenna, the major portion of which occurs in the loading coil.
Some programs make the power budget immediately available. Others provide alternative useful data, such as losses in loads of Type 0, 1, and 4. In many instances, it is important not just to know the overall losses in an antenna, but as well to identify the sources of these losses.
                      - - - RADIATION PATTERNS - - -

- - ANGLES - -  - POWER GAINS -       - - E(THETA) - -      - - E(PHI) - -
THETA   PHI   VERT.   HOR.    TOTAL    MAGNITUDE  PHASE   MAGNITUDE   PHASE
DEGS   DEGS    DB      DB      DB       VOLTS      DEGS     VOLTS      DEGS
90.00  0.00 -157.31 -999.99 -157.31  1.79796E-08 -39.79  0.00000E+00   0.00
90.00  1.00 -157.31  -34.18  -34.18  1.79772E-08 -39.80  2.57884E-02 140.20
90.00  2.00 -157.31  -28.16  -28.16  1.79700E-08 -39.82  5.15721E-02 140.18
90.00  3.00 -157.32  -24.64  -24.64  1.79581E-08 -39.86  7.73462E-02 140.14
90.00  4.00 -157.33  -22.14  -22.14  1.79415E-08 -39.91  1.03106E-01 140.09
90.00  5.00 -157.34  -20.20  -20.20  1.79200E-08 -39.98  1.28847E-01 140.02
90.00  6.00 -157.35  -18.62  -18.62  1.78938E-08 -40.06  1.54563E-01 139.94
90.00  7.00 -157.37  -17.29  -17.29  1.78629E-08 -40.16  1.80251E-01 139.84
90.00  8.00 -157.38  -16.13  -16.13  1.78271E-08 -40.27  2.05905E-01 139.73
90.00  9.00 -157.40  -15.11  -15.11  1.77866E-08 -40.39  2.31520E-01 139.61
90.00 10.00 -157.42  -14.20  -14.20  1.77413E-08 -40.53  2.57091E-01 139.47
The only radiation pattern requested for our center-loaded dipole is an azimuth pattern at an elevation angle of zero degrees. Only the first 10 degrees of the report are shown here. When the entire data series is plotted, the pattern has the appearance of Fig. 4.
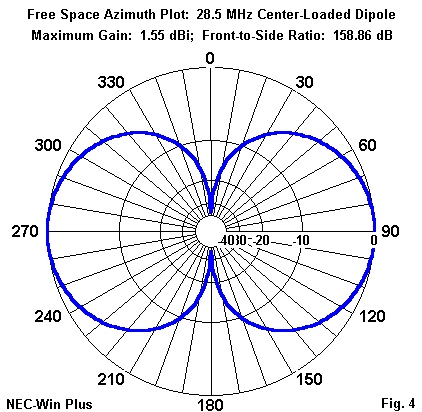
Because graphical plotting involves the use of lines having some thickness on a finite overall graph size, some angles are difficult to resolve visually. Consequently, the radiation table report--often made separately available by implementations of NEC--is a useful source of data. The portion of the 360-degree report shown here includes the first 10 degrees, beginning with a direction that is at the side null of the dipole pattern. The depth of a free-space dipole null is indicated by the total field power gain. By comparison with the value at the next degree of pattern resolution, one can see to what extent this deep null is a point value and what sorts of values are more realistic to expect of an antenna that does not quite stand still in a small breeze.
Very often, you can make important data more graphically accessible via rectangular graphs. Some software packages have internal rectangular graphing capabilities. However, in all cases, you can transport the data to a spreadsheet, where even more powerful graphing capabilities are normally available. In the present case, we can easily graph the radiation pattern on a rectangular chart to show the deep nulls, as in the top half of Fig. 5.
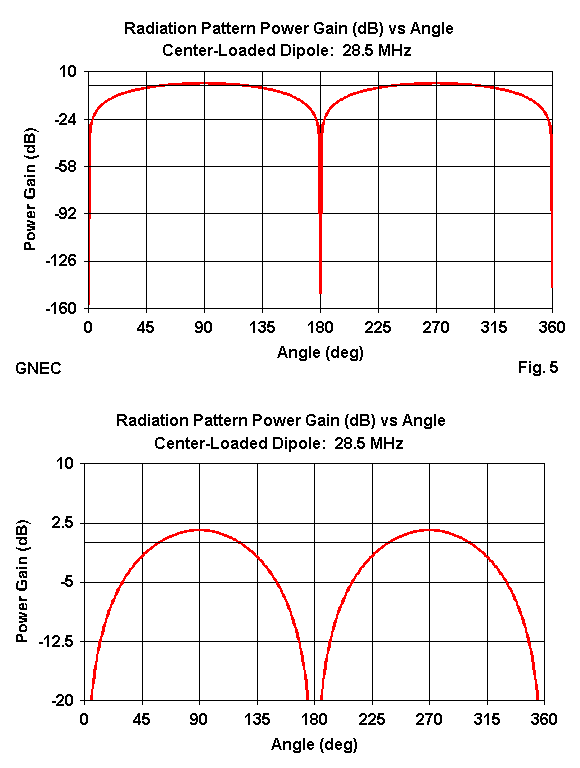
What we gain in the ability to see the fine detail of the side nulls, we lose in terms of possibly misinterpreting the higher gain portions of the antenna pattern. The flat tops of the gain peaks in the upper graph do not permit resolution of important gain changes as we change the azimuth heading. However, by changing the Y-axis scale, we can enhance the presentation of these changes, as shown in the lower half of Fig. 5.
In the end, translating tabular data into graphical form requires great care in order to present data accurately and without leaving misleading impressions. In all cases, be prepared to refer to the tabulated data in the NEC output report to resolve questions left by any graphic presentation.
To make effective use of the radiation pattern report, it is important to understand the conventions used by NEC. The conventional elevation angle counts from the horizon upward, while the theta angle used by NEC counts from the zenith downward. Hence, a zero-degree elevation angle is a 90- degree theta angle. In addition, phi angles count in a counterclockwise direction, while azimuth angles use compass headings clockwise around the circle. (For most symmetrical antennas, the azimuth-phi distinction makes little or no difference, and I have seen software that simply uses the phi-angle as is while calling it an azimuth angle.)
The report provides power gains in dBi (isotropic) for both vertically and horizontally polarized radiation, as well as the power gain for the total field. Ordinarily, all three fields are available graphically as well as tabularly.
NEC also provides theta (vertical) and phi (horizontal) values of the electrical field of an antenna, in terms of voltage magnitude and phase (in volts per meter). Since no range is specified in the most typical pattern specifications (like the one we have been using in our example), the voltage values shown are the voltage as the range approaches infinity. I have shown them to illustrate some of the further data available for special purposes, and even further available columns of polarization information has been omitted.
Had we chosen a different example, the resulting NEC output file would have looked somewhat different, but mostly by way of additions. Over real ground (fast or Sommerfeld-Norton), there would be a ground calculation entry of considerable interest. Additional sources and loads would have enlarged the entries for these items. Requests for alternative outputs--available in some implementations of NEC--would have produced substitutes for or additions to the pattern report we used in the sample.
For complex antenna structures and requests for further output data, a NEC output file can grow to very significant proportions--proportions that defy printing except in cases where preservation of the data is vital. For example, a frequency sweep of free-space azimuth patterns for an antenna on 10 meters from 28 to 29 MHz at 0.1 MHz intervals would have yielded 11 pattern reports, each with 360 lines for a 1-degree resolution setting. In some implementations, it is also possible to make multiple pattern requests, which for the example might consist of an elevation pattern. The number of pattern reports in the frequency sweep would double. Now suppose we had chosen as our model antenna a 5-element quad beam, each element of which consisted of 4 wires with about 11 segments per side. The 880 segments would each appear in the segmentation data portion of the report.
For reasons such as these, implementations of NEC rarely make all of the data in the NEC output file available, although some make the file itself available for consultation. Instead, they extract the most crucial information from the file and present it in separate tables, often in formats that make reading easier. The most common change is to convert the engineering notation to plain decimal notation, with a limit set to the number of digits shown.
At the same time, implementations of NEC will often provide additional information that can be calculated from the NEC output file. The most prominent example is SWR data, which is normally referenced to 50 Ohms and to user-selected values. In some software, load loss figures are also available. These are only samples of many possible pre-NEC and post-NEC calculations that can enhance the basic core functions for the user.
As you develop your modeling skills, you will discover that reference to the basic NEC output file becomes a normal part of the modeling routine. Familiarizing yourself with the types of data available and the ways in which the data is formatted can enhance the utility of the output file in your work. This note has at most pointed the way to the file, but has not yet penetrated significantly into what is available there. Penetration comes with the well-defined tasks that you will develop as you continue to model antennas.