Linear loads do not model accurately using the TL facility of NEC. There are two major factors (and a number of minor ones) that contribute to the inaccuracy. First, the currents on the wires of the linear load are rarely, if ever, exactly equal in magnitude and opposite in phase. Consequently, the linear load does not as a pure transmission line. Second, most applications of linear loading snug the parallel load wires close to and parallel to the main radiating element. This placement creates complex interactions between the linear load wires and the antenna wire. often to the point that the contributions of each wire to the total far field and to the total element length cannot easily be distinguished.
Nevertheless, NEC is able to physically model linear loads with a good level of accuracy, where "good" might be provisionally defined as providing reasonable guidance for building or providing reasonable calculations for analysis. Good accuracy, however, is subject to certain restrictions. For example, for best accuracy, the wires comprising the antenna element and the wires comprising the linear load must be the same diameter to avoid both closely spaced wires of differing diameters and wires of different diameters meeting at an angular junction. In both cases, NEC results can be quite inaccurate. One consequence of this restriction is that NEC cannot directly model most of the existing commercial antennas employing linear loading, since these antennas generally use element and load wires of radically different diameters.
MININEC is subject to neither of these restrictions. With due attention to the need for very short segment lengths at angular junctions and to the overall segment limitation of many versions of MININEC, the program is capable of directly modeling virtually any linear loaded element. MININEC was the program of choice in my 10-meter study of linear loaded dipoles and Yagis in "Modeling and Understanding Small Beams: Part 4: Linear-Loaded Yagis." Communications Quarterly, (Summer, 1996), pages 85-106. These antennas used 0.75" aluminum elements and #12 copper wire linear loads, and MININEC provided excellent building guidance. Despite the different materials used, no construction correctives could be directly attributed to the program limitation of specifying a single material for the entire modeled structure. For conservative predicted results, the higher loss material (aluminum) was used throughout the modeling.
Nonetheless, NEC (either -2 or -4) can model linear loaded elements where all wires are of the same diameter. This much capability is sufficient to reveal a number of linear load properties that are fundamental to this loading technique. Consequently, we may for this exercise employ some of the models already developed for other parts of this series and simply add to them various linear load configurations. Central to the work in this episode will be the 34.39' (412.68") short dipole that we have loaded in several ways. We shall principally use the #8 wire version. Throughout, we shall retain the use of 91 segments for the overall antenna main element, with an average segment length of about 4.53". This segment length will determine several other parameters in the course of physically modeling transmission lines or linear loads.
In previous exercises, we have used perfect or zero-loss wire for the dipole element. So long as we could specify load losses in Type 0 or Type 4 loads (series R-L-C and series R-X loads, respectively), we could isolate losses directly attributable to the load. In this exercise, we shall physically model linear loads as wires in the antenna structure. In order to leave the "main" element perfect and register the material losses of the load wires, we shall have to use either NEC-Win Pro or GNEC (NEC-2 and NEC- 4 programs from Nittany Scientific), as these are the only commercial versions of NEC commonly available that permit specification of different materials for each wire in the antenna.
Modeled transmission lines must be parallel wire assemblies, since there is no practical way to model coaxial cables. (It is possible to simulate the cable braid with several wires of the same diameter as the center wires, but the cost in wire segment total makes the technique impractical here.) However, since a parallel wire line with significant spacing between wires represents the most common form of linear loading, this restriction will impose no problems.
The linear loads we shall use will have a spacing of 4.53" center-to-center between wires. The diameter of a #8 AWG wire is about 0.1285". We can calculate the anticipated characteristic impedance of the resulting parallel line from this standard equation:

where Zo is the characteristic impedance in Ohms, S is the center-to-center spacing of the wires, and d is the wire diameter, with both S and d in the same units. For the #8 line, the Zo is 510.1 Ohms.
The standard equation presumes an indefinitely long line without connection wires to either a source or load. Moreover, it is invariant for any wire type and thus does not account for variations in the materials one might use for an open line. (In addition, it does not account for spacers, insulation, and other line variables that are not a part of this exercise.) In fact, wires physically arranged as parallel transmission lines do not model with precisely the same characteristic impedance as those yielded by the standard equation.

We can model transmission lines to determine their characteristic impedance using the figure above as guidance. The "top" and "bottom" wires are single segments, each 4.53" long. The parallel wires will be an odd multiple of a quarter wavelength for the frequency tested. In our case, the frequency is 7.15 MHz, and we shall check the line using lengths of 1/4, 3/4, and 5/4 wl.
By adjusting the line to a length that yields resonance at the source for a given load, we can find the characteristic impedance of the line from the standard equation,

where Zo is the characteristic impedance of the line, ZL is the load impedance, and ZS is the source impedance. If we use a purely resistive load and bring the line length to resonance (defined as usual as less than +/- 1 Ohm reactance), the calculation is simplified. Let us initially specify a load of 5,000 Ohms resistance with a zero-loss (perfect) #8 wire line and see what we get.
Test Length    Resonant     ZS           Zo       Segs/Length    Delta L"
 in WL         Length "  R +/- jX       Ohms
1/4             409.9    59.2 - j 0.1   544.1      91 / 4.50"    2.75"
3/4            1236.6    59.3 - j 0.0   544.6     271 / 4.56"    1.45"
5/4            2063.0    59.5 + j 0.0   545.3     451 / 4.57"    0.40"
The "Delta L" figure is the departure of the resonant length from a perfect odd multiple of a quarter wavelength. The model has two wires at top and bottom which contribute to the overall line length and become error sources with respect to having a perfect parallel transmission line. However, the error they introduce decreases as the test line length increases.
The selection of 5000 Ohms as the resistive load for this construction was arbitrary. For any given test length for the line, selection of a different load value will give slightly different results. Let's look at a 3/4 wl (1236.6") line and examine the characteristic impedance yielded by various load values.
ZL                ZS                Zo
Ohms           R +/- jX            Ohms
    50         5920.0 - j 40       544.1
   100         2961.0 - j 10       544.2
   250         1185.0 - j 2.0      544.3
 1,000          296.3 - j 0.0      544.3
 2,500          118.6 - j 0.0      544.5
 5,000           59.3 - j 0.0      544.6
10,000           29.7 - j 0.1      544.6
With perfect wire, the range of variation in this second test of the characteristic impedance derived from the test model is not especially significant, with a maximum variance of about 0.5 Ohm for the range tested. The key variance in this exercise is between the modeled-derived Zo and the value calculated by the standard equation: about 33 Ohms--or a 6% variance, with the modeled impedance higher than the calculated value.
If we specify the #8 wire to be copper (Resistivity = 1.72E-08), we end up with slightly different tables relative to those for perfect wire:
Test Length    Resonant     ZS           Zo       Segs/Length    Delta L"
 in WL         Length "  R +/- jX       Ohms
1/4             409.7    60.1 + j 0.1   548.1      91 / 4.50"    2.98"
3/4            1235.6    61.7 - j 0.0   555.4     271 / 4.56"    2.44"
5/4            2061.0    63.4 - j 0.1   563.1     451 / 4.57"    2.40"
The range of variation in derived Zo for the different test lengths, using the arbitrary 5000-Ohm load, is almost 15 Ohms. This represents a range of change of around 3%, which is well within the range of variation in real lines, especially those with insulation and a consequential velocity factor. However, the question remains as to whether the test yields accurate results. The second test provides the clue we need.
ZL                ZS                Zo
Ohms           R +/- jX            Ohms
    50         5669.0 - j 80       532.4
   100         2901.0 - j 22       538.6
   250         1179.0 - j 5.3      542.9
 1,000          298.5 - j 0.5      546.3
 2,500          121.0 - j 0.1      550.0
 5,000           61.7 - j 0.0      555.4
10,000           32.0 - j 0.0      565.9
Note: when using low values of load impedance, it may not be possible to remove all of the reactance to the arbitrary standard of resonance that we have been using (+/- 1 Ohm reactance). However, if the reactance value is less than about 2% of the resistive value and slight line length changes to achieve resonance do not change the resistive value significantly, then the resulting resistive value will be usable.
The test using different load values shows a wide range of values both above and below the values yielded by the perfect wire test. Since the approximate value of the characteristic impedance is also approximately the geometric mean between the adjacent load values (250 and 1000 Ohms), we can zero in on the actual line impedance by using that mean as a new load. If the first try does not yield a source impedance equal to the load we chose, we can adjust the load slightly until the results are equal within about 0.1 Ohms (to allow for rounding conventions in the software).
Using this method, the final value for the perfect wire Zo is a little over 544.3 Ohms, while the final value for the copper wire is a little over 544.8 Ohms: very close indeed. In fact, we have extended the number of significant digits with respect to the characteristic impedance of the line too far for practical purposes in order to ensure clarity of the mathematical progressions. A value of 544 or 545 Ohms would suffice for all practical enterprises. This conclusion means that running the characteristic impedance modeling test with perfect wire with any reasonable load would have produced an acceptable result with a single test run.
We have lingered over the transmission line modeling test not only to show that transmission line characteristic impedance may differ in modeling software from values derived from standard equations, but as well to ensure that when modeling transmission line loads, we do not draw the wrong conclusions from the results we encounter. In order to get a handle on drawing the right conclusions, the next step is to model some transmission line loads using our #8 parallel transmission line. Because the principles do not change whether or not we account for wire losses and because the models are for demonstration purposes and do not represent structures anyone would actually build, we may use perfect wire transmission lines for these tests.
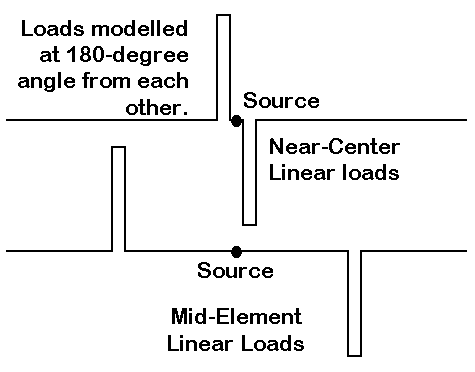
The models we shall construct use the basic 34.39' #8 perfect wire dipole. We shall insert transmission line loads at the segments adjacent to the feedpoint or source segment in the center and later at the points in the lines calling for 833.3-Ohm mid-element loads. From previous episodes of this exercise, we determined that loads placed immediately adjacent to the source for the 91-segment model required a reactance of 426.3 Ohms. We also used the 5-wire model to arrive at the positions of loads requiring 833.3 Ohms (the value of a single center load for this antenna).
For our model, we may place the transmission lines parallel to each other or at 180 degrees apart. I have chosen the latter type of model to minimize interactions between the transmission lines, especially in the close-spaced model. Whichever model we choose, there will be a significant radiation component at right angles to the radiation from the main element.
Let us take the Zo of the transmission line as 544 Ohms. Using the equations shown in earlier episodes, the 426.3-Ohm load requires a transmission line length of 174.6" while the 833.3-Ohm load is 260.7" long. Modeling these lines via the TL facility, in which the lines are mathematically but not physically modeled, would require these calculated values.
Physically modeling the lines tells a quite different story, one that reveals why using the TL facility of NEC yields inaccurate results. To achieve resonance with the closely-spaced transmission line loads required a length of 155.3" for each line, almost 20" shorter than called for by the equation. The mid-element model required loads that were 157" long, more than 100" shorter than called for by the standard equations. (For alternate models using lines that parallel each other, the values were 151.2" and 156.5" respectively.) Each loading transmission line replaced one segment of the main element and the spacing was set at 4.53" between transmission line wires.
A transmission line acts as a pure transmission line if and only if the currents everywhere along the line are equal in magnitude and opposite in phase on the two wires. An examination of the current tables produced by the NEC core reveals the degree to which this condition is not met by physical lines used as loads. In constructing models to perform this test, it is essential that the segments on each wire align perfectly.
The current phase differential along the transmission line wires does not exceed 0.4 degrees in either case, so current magnitude comparisons are sufficiently accurate for the level of analysis required here.
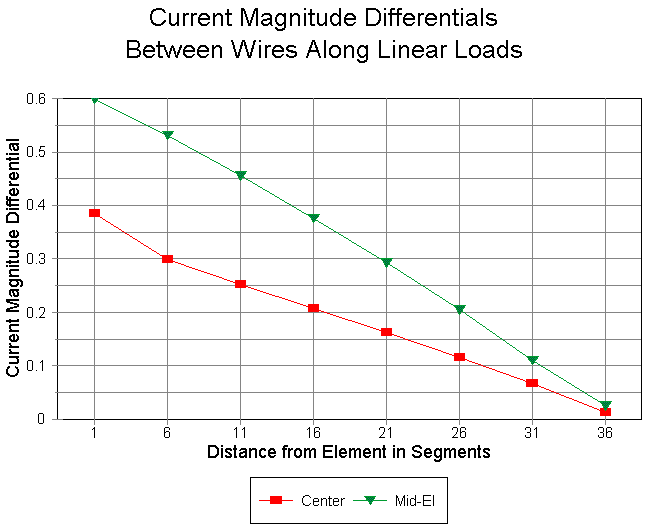
The graph shows the current magnitude differential between the transmission line wires for both cases tested. Current differential is greatest where the transmission line joins the main element. It does not reach zero at the far end of the line. The level of current differentials is far less along the closely-spaced or "center" load lines than along the mid-element load lines. Note, however, that there is nothing like a linear relationship between the degree of current magnitude differential and the degree of shortening of the lines.
The current differential is an indicator of--but not a measure of--the fact that the lines have significant radiation. As radiating lines, they contribute linearly to the length of the antenna. To the degree that the wires in the load contribute to the linear length of the antenna wire, less reactive loading is required, and the lines required will be shorter than called for in standard equations. The higher the current magnitude differential, the greater the contribution to the antennas linear length and the higher the level of load shortening relative to equation-derived values. By mid-element, the contribution to the wires to the antennas linear length is so great that the load lines may be over a third shorter than their calculated value.
In designing this overall exercise, I specifically chose a very short dipole (about 1/2 normal length) in order to set the effects we have noted in bold relief. Antennas only mildly shortened will show lesser current differentials in each of the models, and the degree of load shortening will be correspondingly less. Nonetheless, I know of no way of eliminating the fact that transmission line loads act as both reactive loads and as part of the linear antenna length--short of eliminating transmission lines as loads.
The placement of the loads in this drill is far from optimal for maximum performance for the antenna. The gain of the close-spaced or center load model is 1.67 dBi, while the gain of the mid-element model is 1.88 dBi. The latter value is comparable to the values for zero-loss center and mid- element R-L-C loads (1.85 and 1.87 dBi, respectively), but there is considerable cross-polarized radiation that reduces the normal side nulls of a free space dipole model.

Before we leave these informative but impractical models, we should briefly examine the SWR curves (relative to the source impedance at resonance for each model). The close-spaced or center loaded model shows a curve consistent with those we examined earlier in connection with transmission line loads generated with the TL facility. The mid-element line, in contrast, shows a very shallow curve, indicating a much wider operating bandwidth. This curve is in stark contrast to curves associated with TL- generated loads.
The source of the broader SWR curve for the mid-element transmission line load lies mostly in the fact that the load lines act to a much higher degree as part of the linear or radiating length of the antenna. Consequently, the SWR curve approaches that of a standard full-size dipole. The major difference is that the shortened dipole has a resonant impedance of about 20 Ohms. (The resonant impedance of the close-spaced model is under 10 Ohms. The impedance of a perfect center-loaded dipole in this series of models is about 13 Ohms, while a perfect mid-element loaded version shows a resonant impedance of about 27 Ohms.)
The transmission line loads that we have just explored place the load lines at right angles to the main element in order to minimize interactions. Conventional linear loads tend to place the loading lines parallel to and close by the main element.
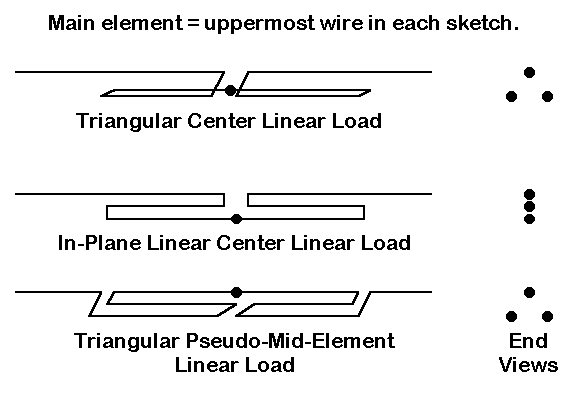
The sketch shows three typical linear load line assemblies. Actual antennas tend to fall into one of the three categories, although details may vary. The triangular load at the top feeds the center junction point of the linear load shorted lines, which then attach to the main element. Although we cannot accurately model actual structures in this exercise, the main element of most antennas of this type will be much larger in diameter than the load lines. For many purposes, the load lines may be placed in a plane with the main element, as shown in the middle sketch. Once more, the main or upper element will be larger in diameter than the load lines.
A third popular assembly is shown at the bottom as a mid-element linear load. In this case, a "main" or larger diameter element is the feedpoint. The apparent load lines begin at mid-element and return toward the center, terminating and returning to the completion of the main element. Ordinarily, the apparent load lines are placed symmetrically about the main element, forming a triangle or a single plane. Why the sketch refers to this schema as a "pseudo-mid-element linear load" will become apparent as we proceed.
The models for the tests were carefully constructed to achieve several goals. The segments throughout are all close to 4.53" long, and the spacing between lines is exactly that figure. Hence, the triangular models form equilateral triangles so that the influence of the main element is as equal upon both load lines as possible. The center separation between load ends (shorting segments) is also 4.53" or one segment's length. This procedure permitted alignment of all segments both between the load wires and on the main segment as well. All of the models are #8 AWG wire.
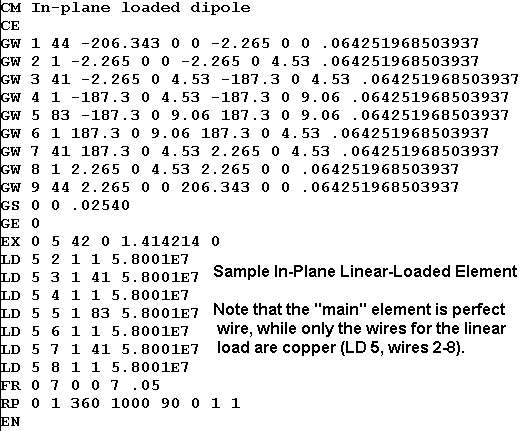
In this sequence of test, however, we shall look both at load lines that use perfect wire and lines that use other materials. The figure below shows an in-plane model in which only the load lines (wires 2 through 8) are copper. In this way, we may isolate the losses due to the load from the losses due to the main element wire, which remains a perfect or zero- loss wire like the ones used in earlier R-X and R-L-C load models.
The table below presents the load line lengths, measured from the source point for each of the three types of loads modeled. The "triangular mid- element" load line is measured from the source point both to the start and to the finish of the line outward. For the center triangular and in-plane models, line lengths for perfect, copper, and aluminum load lines are recorded, while the mid-element line is recorded only for the perfect wire version.
Antenna             Load Material       Load-Line Length (")
Triangular Center   Perfect             175.2"
                    Copper              174.5"
                    Aluminum            174.35"
In-Plane Center     Perfect             188.0"
                    Copper              187.3"
                    Aluminum            187.15"
Mid-Element         Perfect             176.43" (outer)
                                        171.90" (inner)
The decrement in length for the loads with the use of materials having a reduced conductivity is identical for both the triangular and the in-plane models. The load length for the in-plane model is longer than for the triangular or the mid-element model. However, the mid-element model load structure is virtually identical in length to the equally triangular center loaded model. Note that the triangular model load lengths correspond very closely to lengths for a split center load reactance when calculated from standard equations using the 544-Ohm Zo of the load line. For the required 416.7-Ohm load, the required load line calculates to 171.7" or within 2% of the actual modeled line lengths.

Although the triangular models are physically set to minimize unequal influence from the main element, the current differential on the load wires is not zero. The graph shows the two values of current differential to be almost precisely the same for the zero-loss wire models, with closely corresponding phase differences as well. With the exception of a 4.53" change of wire alignment, the two models are the same model in every operational respect. In the mid-element model, the so-called fed main element is actually one leg of the loading line, and the apparent second leg of the loading line corresponds to the main element in the triangular center-loaded model.
In contrast, the current differential between the load wires of the in- plane model is much higher. The higher differential is due to the differential interaction between the main element and the individual wires which are at different distances from the main element.
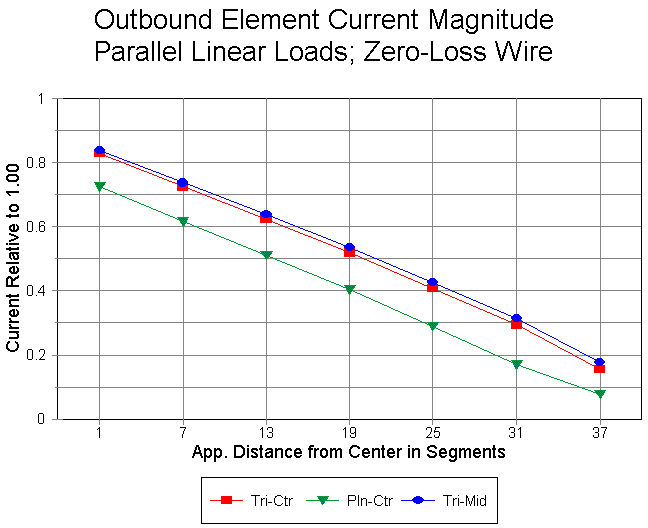
A further insight into the difference between the triangular and the in- plane models can be gather from examining the currents on the main element outward from center. Note once more the close coincidence between the triangular models. In contrast, the current magnitudes along the outbound wire for the in-plane model are lower everywhere. Part of this reduction is due to the increased length of the in-plane linear load, which results in an electrical shift in the position of the beginning of the main element at the antenna's center.
As might be expected, the current distribution on the in-plane model results in a lower gain than for either triangular model. With perfect wire, both triangular models report an anticipated gain of 1.86 dBi, while the in-plane model gain is 1.79 dBi--not a big reduction, but noticeable. With copper loads, the triangular model gain is 1.35 dBi, while the in- plane gain is 1.30. An aluminum (6061-T6) loading wire set yields a gain of 1.11 dBi for the triangular models and 1.06 dBi for the in-plana model. The values for aluminum wire load lines (with perfect wire main elements) correspond closely to the values for center and mid-element load dipoles using R-L-C loads with a Q of 300 (1.02 and 1.11 dBi, respectively).
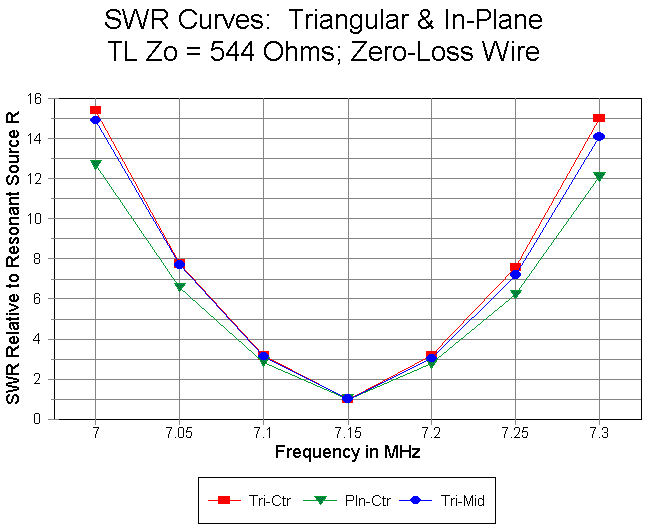
Equally revealing about the behavior of linear loads are SWR curves for the three models, each predicated on the source impedance at resonance at the design center frequency of 7.15 MHz. The resonant source impedances are 12.0, 12.1, and 12.2 Ohms for the triangular center, in-plane center, and triangular mid-element models. The coincidence of the mid-element linear load model source impedance with the center loaded models and not with the mid-element transmission line load model examined earlier is further confirmation that the mid-element model is simply a minor variation of the triangular center loaded model. The SWR curves confirm this further by overlaying each other, while the in-plane curve is slightly broader, as one might expect of a very slightly lossier structure. The mid-element linear load model no where approaches the broadness of the mid-element transmission line load we explored earlier.

The SWR curves for the triangular model for the three load line materials show the expected broadening of the curve with the use of materials with a lower conductivity. Similar results accrue to the in-plane model.
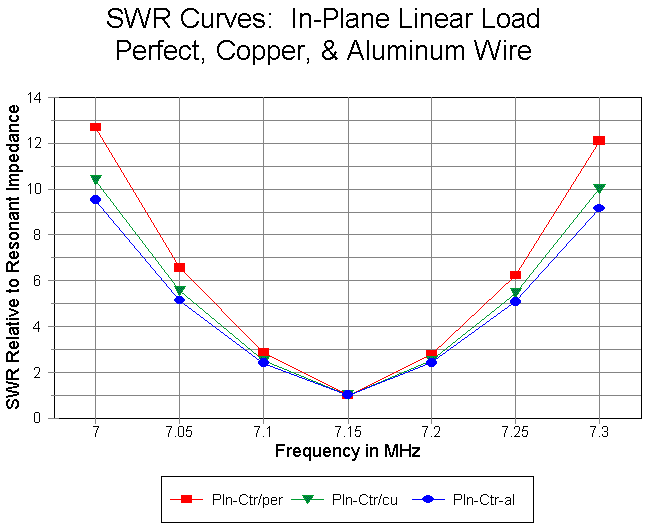
The linear load is essentially a shorted transmission line stub placed in line with the main element of the antenna it loads. As an antenna load, the stub cannot act as a pure transmission line; the current can never be equal in magnitude and exactly opposite in phase on the two wires making up the load line, since the current magnitude and phase on the antenna element into which it is inserted is not the same at any two points along a path from the antenna center outward. However, the condition is most closely approximated when loads are as exactly at center as possible and symmetrically placed about the main element to equalize its influence on each load wire.
Since linear loads are transmission lines and answer in part to the equations for calculating length from required loading reactance-- especially when placed at the center of the antenna structure--their operating bandwidth curves, as reflected in the SWR curves shown, are narrower than for corresponding R-L-C loads.
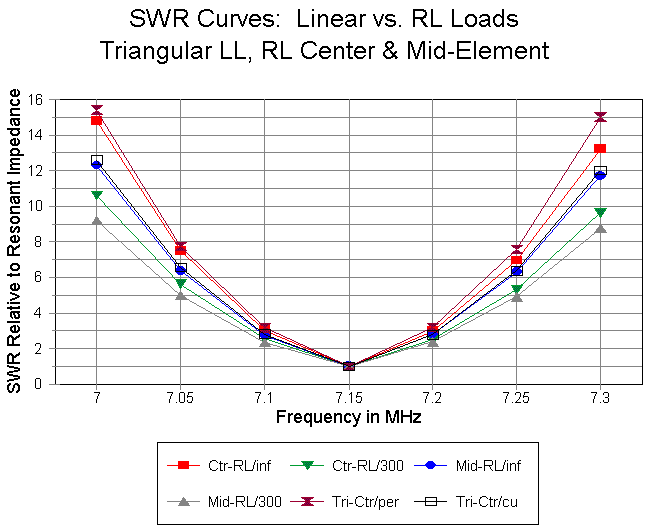
The graph above plots curves for center and mid-element loads using perfect loads and loads with a Q of 300. Additionally, the graph records the SWR curves for the triangular linear load model using perfect and copper wire. note that the curve for the copper wire linear load is sharper than any of the R-L-C loads except the center load with infinite Q. The broadest lines in the curve are for R-L-C curves with a Q of 300.
Because the operating bandwidth of a linear load rests in large part on transmission line stub behavior and not on solenoid inductor behavior, losses cannot be directly correlated with operating bandwidth. Within each type of load, increases in bandwidth might point to increasing losses in the loads. However, cross-load type correlations are far less certain.
To the degree that the currents on the linear load transmission line stubs are unequal, the wires also contribute to the linear length of the antenna. If placed at right angles to the main element wire, the radiation appears as a cross polarized field relative to the radiation from the main element. Moreover, the larger the current magnitude differential between load line wires, the more the wires act as linear contributions to the overall antenna length and the shorter the required stub.
As with any complex electrical structure inserted into an antenna and modeled physically, the modeling calculations cannot directly account for all phenomena. For example, some theory exists to suggest that transmission line wires have greater losses for a given wire size and frequency of RF current than that same wires in an electrical circuit, due to the effects of the intense field between the wires. However, these effects turn out to be small, even for the long linear loads used in the very short modeled dipole. MININEC tests and other marginally valid tests within NEC suggests additional total field antenna gain losses between 0.1 and 0.2 dB. These losses, if present, have no noticeable effect on the operating bandwidth of the linear-loaded antenna models.
While the bulk of the transmission-line view of linear loads has been previously established, presenting it here is useful if--for no other reason--than because it raises an interesting question. Just as linear loads have unequal current magnitudes at their junction with the main antenna element as a function of the current distribution along an antenna element, it would appear that solenoid inductors used as loads would share the same behavior. If this turns out to be the case, then the mathematical specification of loads within NEC would be equally incomplete, despite the high trust antenna designers and analyzers place in R-L-C loads of Type 0 and Type 1.
It may be worth one more episode just to test the hypothesis and confirm (or disconfirm) the trust we place in Type 0 and Type 1 R-L-C loads.