The modeled performance of vertical antennas at or above ground system available in MININEC and NEC shows almost diametrically opposed characteristics. For example, the source impedance will vary by only a small amount, and above about 0.3 wl at the bottom of the antenna, hardly any variation at all. In contrast, the antenna gain and its vertical pattern lobes will vary widely and not altogether according to simplistic expectations as we place a vertical antenna at various heights over soils of differing quality.
Apart from any problems associated with the possible accuracy or inaccuracy of models of vertical antennas above ground, the modeler needs to become acclimated to the range of variations that are typical for vertical antennas. This episode is designed to begin that process, with the hope that modelers will carry on with self-generated series of models of antennas and soil types most relevant to their primary activities.
As we did last month, we shall employ the ground or soil quality categories commonly used. A relevant portion of the chart we used last month is reproduced for more immediate reference.
Soil Description                   Conductivity   Permittivity   Relative
                                   in S/m         (Dielectric    Quality
                                                   Constant)

Salt water                         5.0            81

Pastoral, low hills, rich
soil, typical from Dallas,
TX, to Lincoln, NE                 0.0303         20             Very Good

Pastoral, medium hills, and
forestation, heavy clay soils,
typical of central VA              0.005          13             Average

Rocky soil, steep hills,
typically mountainous              0.002          12-14          Poor

Sandy, dry, flat, coastal          0.002          10

Cities, industrial areas           0.001          5              Very Poor
Except for the salt water entry, only the categories we shall use in our sample models are shown here. In calculating ground effects, modeling programs create from the values inserted for the conductivity and the dielectric constant a composite value. Remember that all MININEC and NEC ground calculations assume level terrain without obstructions other than those modeled. Additionally, they presuppose a homogenous soil beneath an antenna and to the horizon, rather than the sort of stratified soil layers we commonly encounter in practice. The effects of soil stratification are more pronounced at lower frequencies, where RF tends to penetrate more deeply into the ground, than at upper HF frequencies and above.
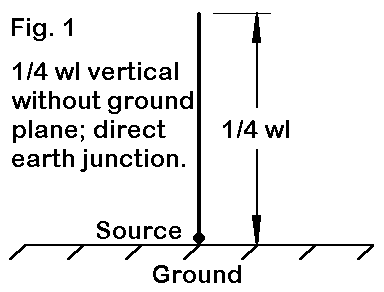
When such antennas are place over perfect ground, the program creates an image antenna for calculations. Whether in MININEC or NEC, the results are virtually indistinguishable.
Program        Gain      Source Impedance
               dBi       R +/- jX Ohms
MININEC        5.14      35.86 - j 0.75
NEC            5.14      36.01 _ j 0.14
The very slight difference in source impedance stems from two sources. First, the source on the MININEC model is at the end of the wire, while in the NEC model, it is inboard, on the first of the 20 segments in this 7.15 MHz model. Second, the required length for resonance (as arbitrarily set to a source reactance limit of +/- 1 Ohm) is 397" in MININEC and 396" in NEC.
When we place these antennas over real grounds of the types available, we obtain far more disparate results. The following table is an illustration. VG is very good, Ave is average, P is poor, and VP is very poor, as defined in the table of ground quality types shown earlier and using the corresponding values of conductivity and dielectric constant in the models.
System         Soil      Gain      TO Angle       Source Impedance
               Quality   dBi       degrees        R +/- jX Ohms
MININEC        VG         1.93     21             35.85 - j 0.75
Real           Ave       -0.05     26             35.85 - j 0.75
               P         -0.29     27             35.85 - j 0.75
               VP        -1.77     29             35.85 - j 0.75

NEC            VG         2.45     21             31.98 - j 0.95
Fast           Ave        0.97     26             28.61 + j 0.43
               P          0.82     27             28.11 + j 1.73
               VP        -0.18     28             25.14 + j 2.20

NEC            VG         0.88     21             45.85 + j 5.41
S-N            Ave       -1.23     26             47.13 + j 3.65
               P         -1.37     27             46.12 + j 4.09
               VP        -2.37     29             41.23 + j 2.13
Although the elevation angles of maximum radiation (TO angles) show excellent coincidence as we move from system to system, little else does. So let's graph some of the results and see what they might tell us.
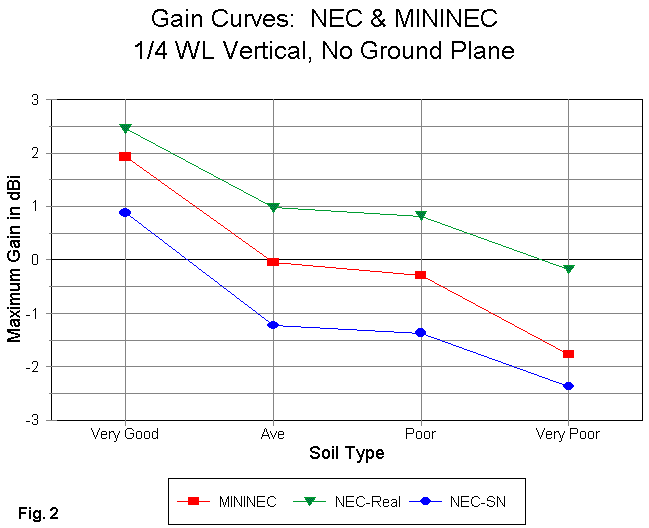
Fig. 2 graphs the reported gain of the antenna over the different soils. The intervals among soil types is not regular, and therefore, the lines should be read solely as connectors to keep the families of values well sorted. Each system shows comparable gain differences as we move from soil type to soil type. However, the reported values are distinctly different for any given soil type.

In Fig. 3, we can view the reported source impedance values for the three systems. The MININEC line is flat because all MININEC source impedance values are calculated from perfect ground. Hence, they do not register any differences occasioned by changes in soil quality. In contrast, the NEC systems provide source impedance values quite distinct from the MININEC value: the "fast" system reporting consistently lower values and the S-N system reporting consistency higher values. However, the NEC progressions are not consistent with each other with respect either to value or to the progression of values from one soil type to the next.
In general, connecting an antenna model to a NEC fast ground is considered the least accurate of all possibilities. The reported gain values are unrealistically high and the source impedance values unrealistically low for connection to a lossy medium like the earth. In contrast, the values for the S-N ground system yield lower gains and higher source impedance reports, giving them an air of realism.
However, the sense of realism may have limited value, since virtually no real 1/4 wl antenna is directly connected to ground without a ground plane. Even were we to try to design such an antenna, at lower HF frequencies, there would be numerous variables of soil penetration and stratification to make the modeling results of dubious reliability. Moreover, I know of no definitive test results that would form a bench mark for assessing the reported values of either gain or source impedance.
In most instances, modeling wires directly connected to ground is performed with a perfect ground and is used as a short-cut to modeling symmetrical antennas in free space. Alternatively, some preliminary modeling of phased and parasitic vertical antenna systems is done over perfect ground. Although the results are not especially accurate with respect to actual maximum gain, other factors--such as pattern shapeand relative improvements--proven useful.
So why have we spent so much space and time on modeling the 1/4 wl antenna touching various grounds? The purpose has been to alert you to what you can expect to see should you attempt such models, whatever the goal and rationale.

Because we wish to maximize accuracy and to watch the variations of source impedance with changes in height, we shall confine ourselves to NEC and the S-N ground system. We shall employ a 7.15 MHz 1" diameter aluminum dipole 792" long with 41 segments and fed at the center. For ease of tracking, we shall record the height of the antenna bottom limit as 0.2 through 1.0 wl up. For reference, the following table records actual bottom and top heights of the antenna.
Height         Bottom         Top
in wl          Height "       Height "
0.2             330           1122
0.4             660           1452
0.6             990           1782
0.8            1320           2112
1.0            1650           2442
Since our exercise is aimed at eliciting some of the features of modeling programs and not at replicating an actual antenna, it matters little that constructing an antenna meeting the above height conditions is not feasible for most builders. If we run this antenna through the various heights and over the soils we have previously defined, we get a fascinating table of results.
Soil      Height         Gain      TO Angle       Source Impedance
Type      in wl          dBi       degrees        R +/- j X Ohms
VG        0.2            1.75      11             67.97 - j 4.01
          0.4            3.02      42             72.54 + j 1.55
          0.6            4.60      33             72.33 - j 1.79
          0.8            5.25      27             71.26 - j 0.14
          1.0            5.37      22             72.48 - j 0.59

Ave       0.2            0.32      14             68.46 - j 2.93
          0.4            1.84      41             72.59 + j 1.01
          0.6            3.14      32             72.13 - j 1.55
          0.8            3.52      26             71.45 - j 0.20
          1.0            3.44      22             72.35 - j 0.64

P         0.2            1.09      14             68.88 - j 2.80
          0.4            1.29      42             72.46 + j 0.86
          0.6            2.58      33             72.15 - j 1.44
          0.8            2.91      27             71.49 - j 0.26
          1.0            3.21       9             72.30 - j 0.62

VP        0.2            1.04      17             69.37 - j 1.91
          0.4            2.03      15             72.49 + j 0.41
          0.6            3.08      13             71.99 - j 1.24
          0.8            3.87      11             71.65 - j 0.31
          1.0            4.43      10             72.19 - j 0.65
The significance of the values may not be immediately apparent in tabular form, so let us take them by categories in more graphical form.

Fig. 5 graphs the gain values report by NEC over S-N ground for the antenna through its height variations, using separate lines for each soil type. Note that, although certain general progressions are clear with respect to maximum gain, there are great irregularities in the graph as well. Especially notable is the apparent good performance of the antenna over very poor soil when compared to the performance of all but the antenna over very good soil. Indeed, below the level of very good soil, the reported gain of the antenna shows a different "leading soil" as we change antenna heights.
This phenomena is not restricted to the particular antenna type used in the example. Similar results accrue to most vertically polarized antennas that do not require a ground plane. For example, side-fed delta loops, rectangles, half squares, and bobtail curtains all display the sort of variability with respect to maximum gain shown in the graph for the 1/2 wl vertical dipole.
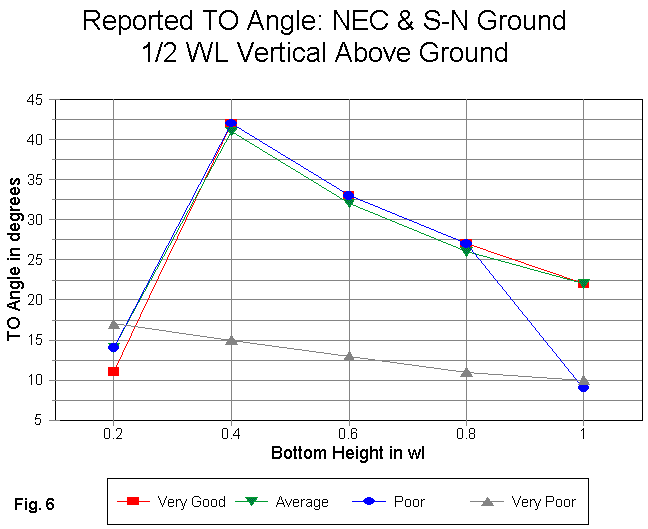
Part of the reason for the gain differentials and irregularities stems from the variability of the elevation angle of maximum radiation, which Fig. 6 demonstrates. Only the antenna over very poor soil exhibits a consistently low TO angle. Note that the antenna, when over poor soil, returns to a low TO angle at the maximum test height at which the bottom of the antenna is 1.0 wl up.
To a degree, graphical results can be misleading and must be supplemented by comparing elevation patterns in order to see and settle many questions about the performance of the antenna over different qualities of soil. Let's begin with the height at which the antennas show a consistently low TO angle: 0.2 wl.
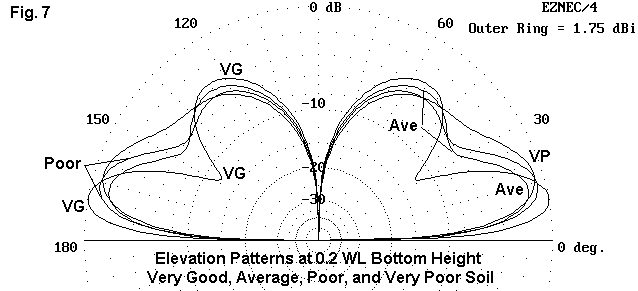
In Fig 7, the elevation patterns for all 4 soil types are overlaid, with some indicators of which pattern is which. Of immediate importance is the fact that only over very good soil does the antenna pattern show a very marked null between the lower and upper vertical lobes of the pattern. In general, the poorer the soil, the shallower the null between the lobes.

With only this much of a clue, we are in a better position to understand the high-low TO angle question. According to the table and the graphs, when the antenna is at a bottom height of 1 wl, it reports a TO angle of 22 degrees over average soil and 9 degrees over poor soil. What the elevation pattern in Fig. 8 shows us is that there is actually little to distinguish the two patterns. Over poor soil, the lower part of the combined (almost null-less) two lower lobes is less than 1 dB stronger than the upper part. In contrast, over average soil, the upper part of the combined 2 lower lobes is about 1 dB stronger than the lower part. The emergent third lobe at an angle of nearly 50 degrees is very similar for both antenna models.
Soils ranging from poor (cond. = 0.002, d.c. = 13) to good (cond. = 0.01, d.c. = 14) can be viewed as middle range soils. They tend to exhibit in models a combined wave front that consists of the two lowest lobes with only an indistinct null between them.

Fig. 9 shows the same antenna at the same height, but over very good and over very poor soil. Over very good soil, the lowest lobe is nearly missing, with only the second and third lobes prominent. In contrast, over very poor soil, the upper lobes become indistinctly differentiated, and the lowest lobe is most prominent. Even though the maximum gain of the antenna over very poor soil is not quite as strong as the maximum gain of the antenna over very good soil, the 7 dB advantage at the lowest angles (in the region of 10 degrees elevation) may be more useful to certain communications needs.
In all of this, we have not mentioned the source impedance of the antenna under any of its conditions of height and soil. Fig. 10 tells us why.
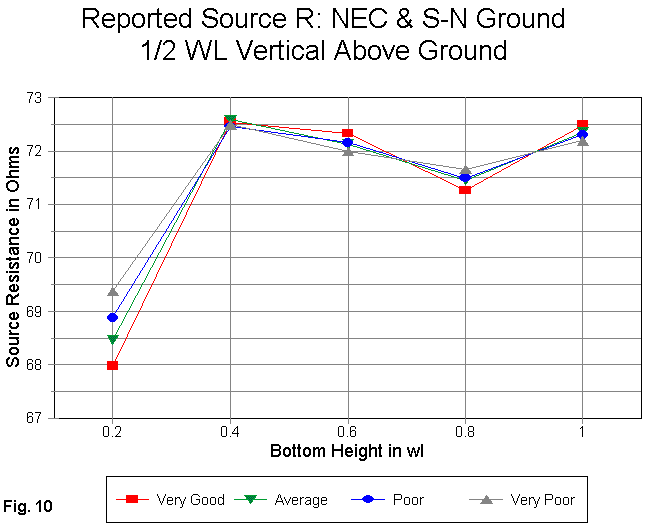
The graph shows that for any given height, the difference in source resistance is insignificant. The total variation in source resistance for all antenna models under all conditions is under 5 Ohms. Likewise, the total variation in source reactance is about 7-8 Ohms for all cases. With 1/2 wl vertical antennas at various heights, the source impedance will be no clue to the type of soil beneath the antenna. More likely candidates as good clues, if the models are at all accurate, will be the antenna's gain and its elevation angle of maximum radiation.
However, we must once again note the restrictions of even the S-N ground system in its assumptions of level terrain and homogenous soil. At lower VLF through lower HF, soil penetration is great and the nature of the complex stratification that often occurs may alter the performance of a real antenna relative to a given model. With vertical antennas, such as the one used in these examples, if translated into a real structure, modeling for a variety of conditions becomes one route to anticipating the possibilities and to analyzing the actual performance results. Indeed, the goal of modeling is sometimes not so much to exactly replicate a given antenna as it is to anticipate possibilities so that we know what they mean and can take appropriate actions, if the situation calls for any.
When the far field has primarily a salt water reflective ground, the performance of vertical dipoles such as the one in our example is significantly enhanced with respect both to gain and to TO angle. WWVH uses (as of 1999) vertical dipoles with the Pacific Ocean as their reflective ground. Boats and ships often use simple vertical antennas, some fairly short for their frequency of operation.

Fig. 11 gives us an illustration of the modeled performance of our vertical dipole over perfect ground and over salt water, with the bottom only 5" above the surface. In contrast to our land models, the salt-water dipole loses little: its reported gain is less than 1 dB less than over perfect ground, and the elevation angle of maximum radiation is 7 degrees. The pattern for the short dipole also shown in the figure is about 2.5 dB down from the full-size dipole over perfect ground, and its TO angle is 9 degrees. This performance report comes from an antenna only 14' long, in contrast to the 66' dipole that is resonant at the 7.15 MHz test frequency. The base height of only 5" is a somewhat extreme case, but demonstrates the potential effect of salt water as a reflective ground for vertical antennas.
Using salt water as the ground for our final examples is just a way of
suggesting that these notes have only scratched the surface of the ways in
which the selection of a ground system and a soil type may interact with
vertical antennas to yield reports whose features form quite different
regularities, compared to those we anticipate for horizontal antennas.
Familiarizing yourself with the possibilities and potentials can go far
toward allowing you to correctly interpret the modeling reports you get.
When you do not have a pressing modeling project to perform, you might
consider taking a variety of vertically polarized antennas and making
systematic runs over many soil types. The results will be both
illuminating and useful when a serious vertical antenna project comes
along.